Here is what we covered:
- How should we update our advice on Transport?
- Feedback from Fue Poverty consultation.
- TDC’s Carbon Reduction plans.
- How reputable sources for tools and data can be misused.
Good venue and company, sorry to anyone who could not find it. I think we’ll try one more location to see if this format works. I’ve had one comment about 16:30 start, especially for those working, this is why we alternate start times. Currently it seems more people prefer a zoom format.
- We went through ACT’s current advice on transport as applied to local councils. This seems to still be very relevant and useful, at least from a town councillor’s point of view. If you have any suggestions/thoughts on this, please send them to me.
ACT also provides advice on more specific actions via the Carbon Footprint Tracker, search for “transport” here. - I attended a very useful online presentation/discussion organised by Regen re the fuel poverty consultation. The points we’d agreed at our last meeting were broadly accepted and echoed by others. Here is a summary, if you’d like the full conclusion on the topic, please contact me:
introduce a progressive unit pricing and/or social structure.
split between standing/unit pricing.
Vulnerable customers don’t use much energy or benefit from flexible tariffs. - TDC are looking to publish their district wide carbon reduction plan. Comprehensive advice is likely to be targeted at officers with some advice to district councillors and local (town/parish) councillors. Their direct advice to residents and businesses is being delivered via the Teignbridge Climate Hub.
- As competition for service and equipment providers increases, several providers are quoting ‘typical’ user benefits, financial and carbon related. These are often based on ‘evidence’ from published tools/calculators provided by reputable sources. Although the tools and evidence is sound, the assumptions made about what a typical use can achieve tend to be unrealistic. However good a tool may be, if you put rubbish in, you get rubbish out!
Here are some good quality resources recently quoted to ‘sell’ a product/service.
System Advisory Model, a renewables technical/financial modelling package
Carbon Tracker, finance and climate change.
ICE database for embodied carbon from Circular Ecology.
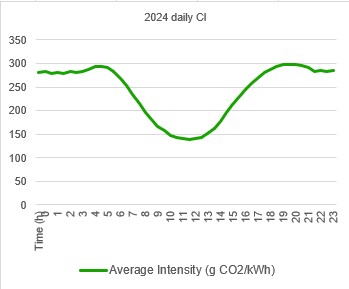
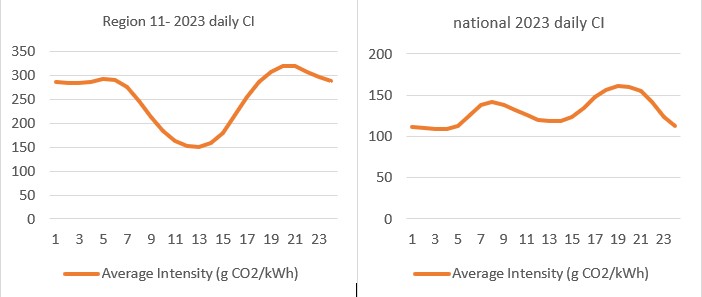
NESO database for grid Carbon Intensities.
The last of these has been an on-going discussion in our recent meetings, particularly in relation to the claim that low electricity night rates reflect a low Carbon Intensity (CI). The following charts represent daily CI in Half Hourly (HH) increments averaged for 2023 plus the annual average CI long-term forecast. What isn’t immediately clear is that the daily CI is in fact for the whole of the UK’s transmission network. This is not at all representative of the CI for the electricity received in the southwest (region-11) which tend to have a very different pattern and generally higher CI.
We’ll be coming back to this as more people in Teignbridge are buying into these tariffs in the belief they are doing the right thing.
Leave a Reply